Topology page displays the topology of the downlink devices of an online switch in the current network. It supports to diagnose the running status of all online networks in a network, and generate diagnosis report.
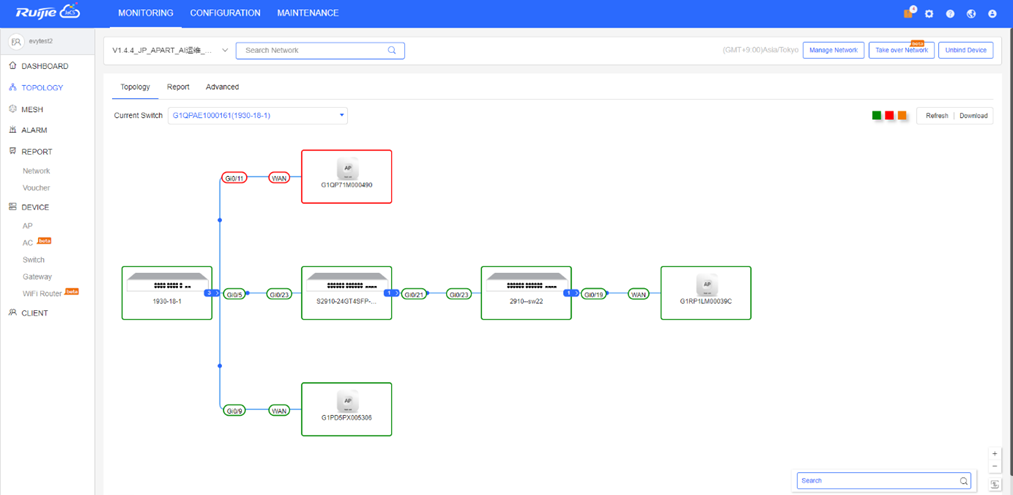
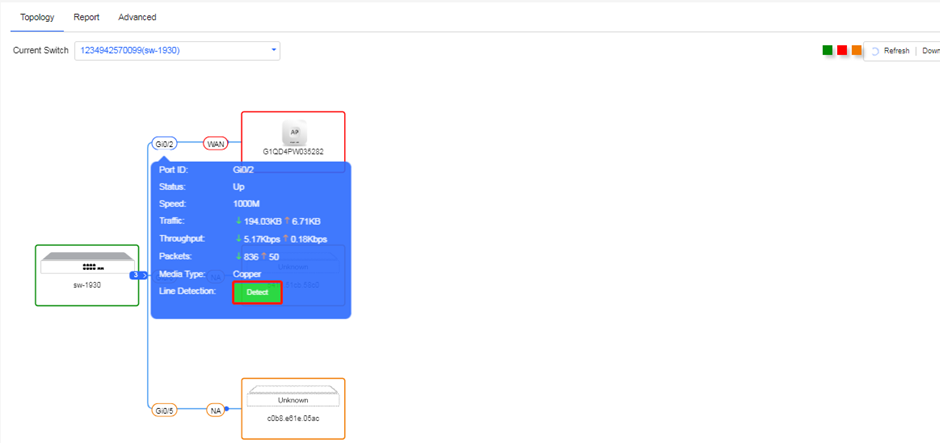
In a topology, when you hover the mouse over a switch, the detail information of the switch will be displayed in a pop-up window. In this pop-up window, you can click the detect button to detect the status of a link. When the link is under detection, please do not perform any operation. Three results may occur as shown follows, including normal link, link failure and no link.
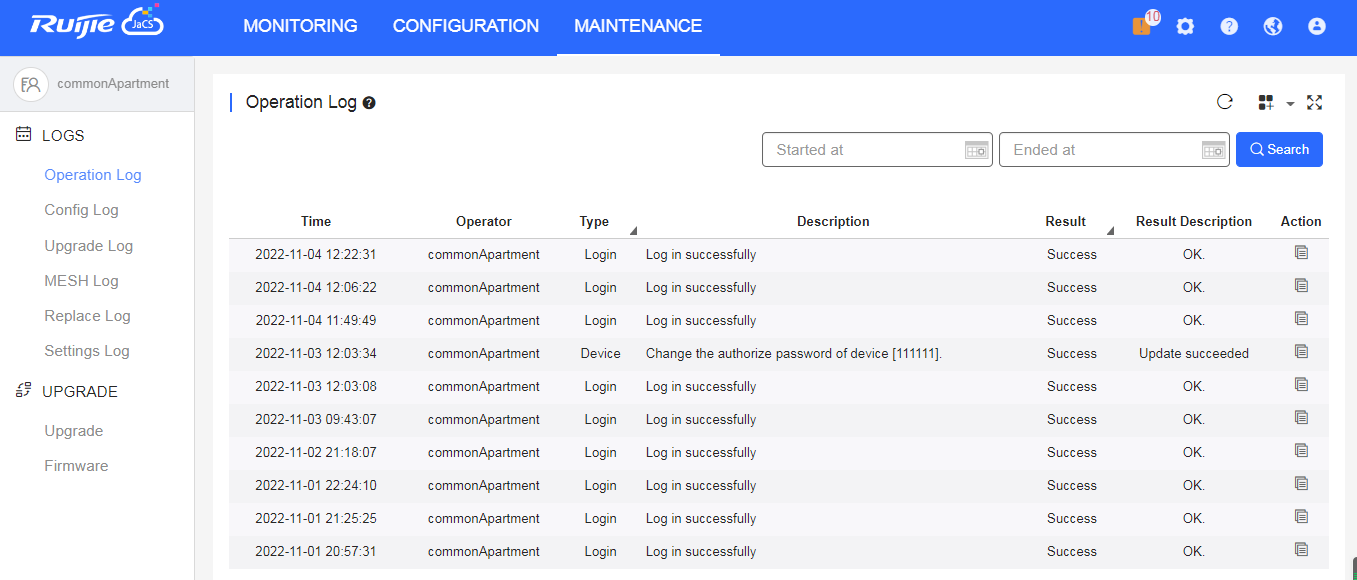
After completing the operation, you can click MAINTENANCE > LOGS > Operation Log to check the log.
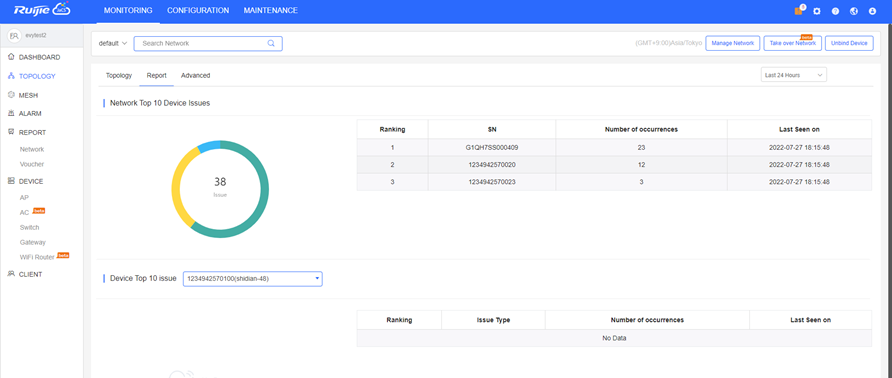
This chart displays the top 10 faulty devices and the last time when the fault occurs in a network.
This chart displays the top 10 failure types occurring among devices and the last time when the fault occurs.
You can hover the mouse over a failure to check the details.
In this page, you can set the time to refresh the topology. The min interval is 2 hours. You also can set a period to refresh the topology. At the start time, the topology will be refreshed once only. If the interval between the start time and the end time is less than 2 hours, the topology will be refreshed only at the start time. If you disable this function, all the settings become invalid.

When you click Start Diagnose, the following figures will be displayed.

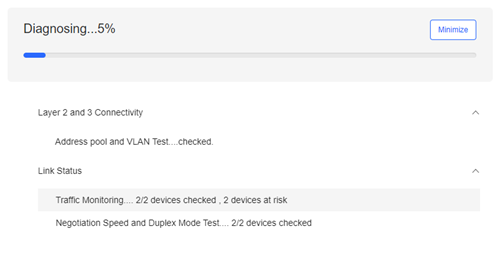
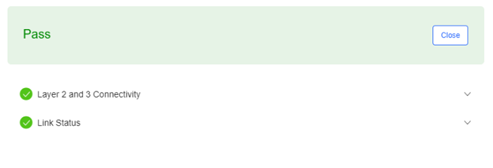
If a risk is detected, the following page will appear.
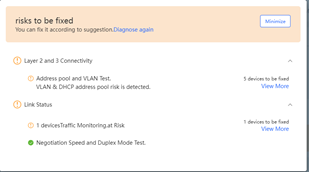
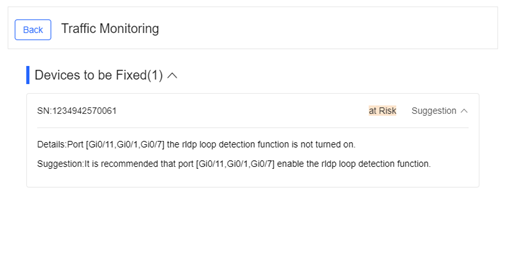
You can click View More to check the details of the risk.
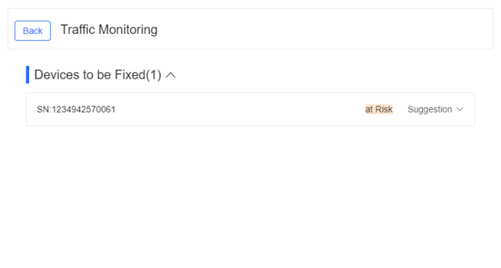
Click Suggestion, a suggestion will be offered to help you fix the issue.
全部评论