Click Project > Network Details > Report to go to the network report management interface. This interface consists of three parts: Summary, Device, and Client.
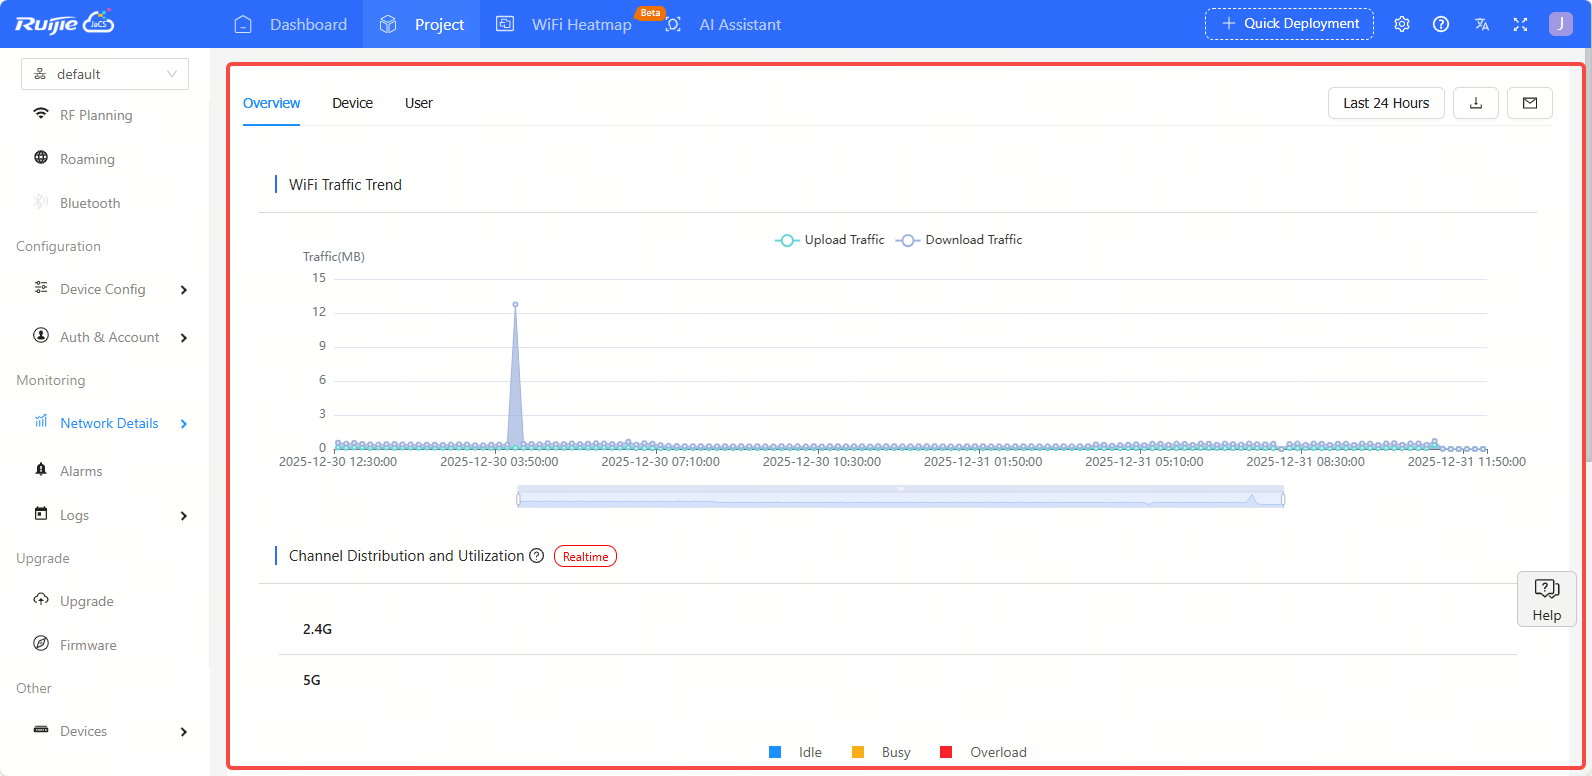
1. Overview Tab:
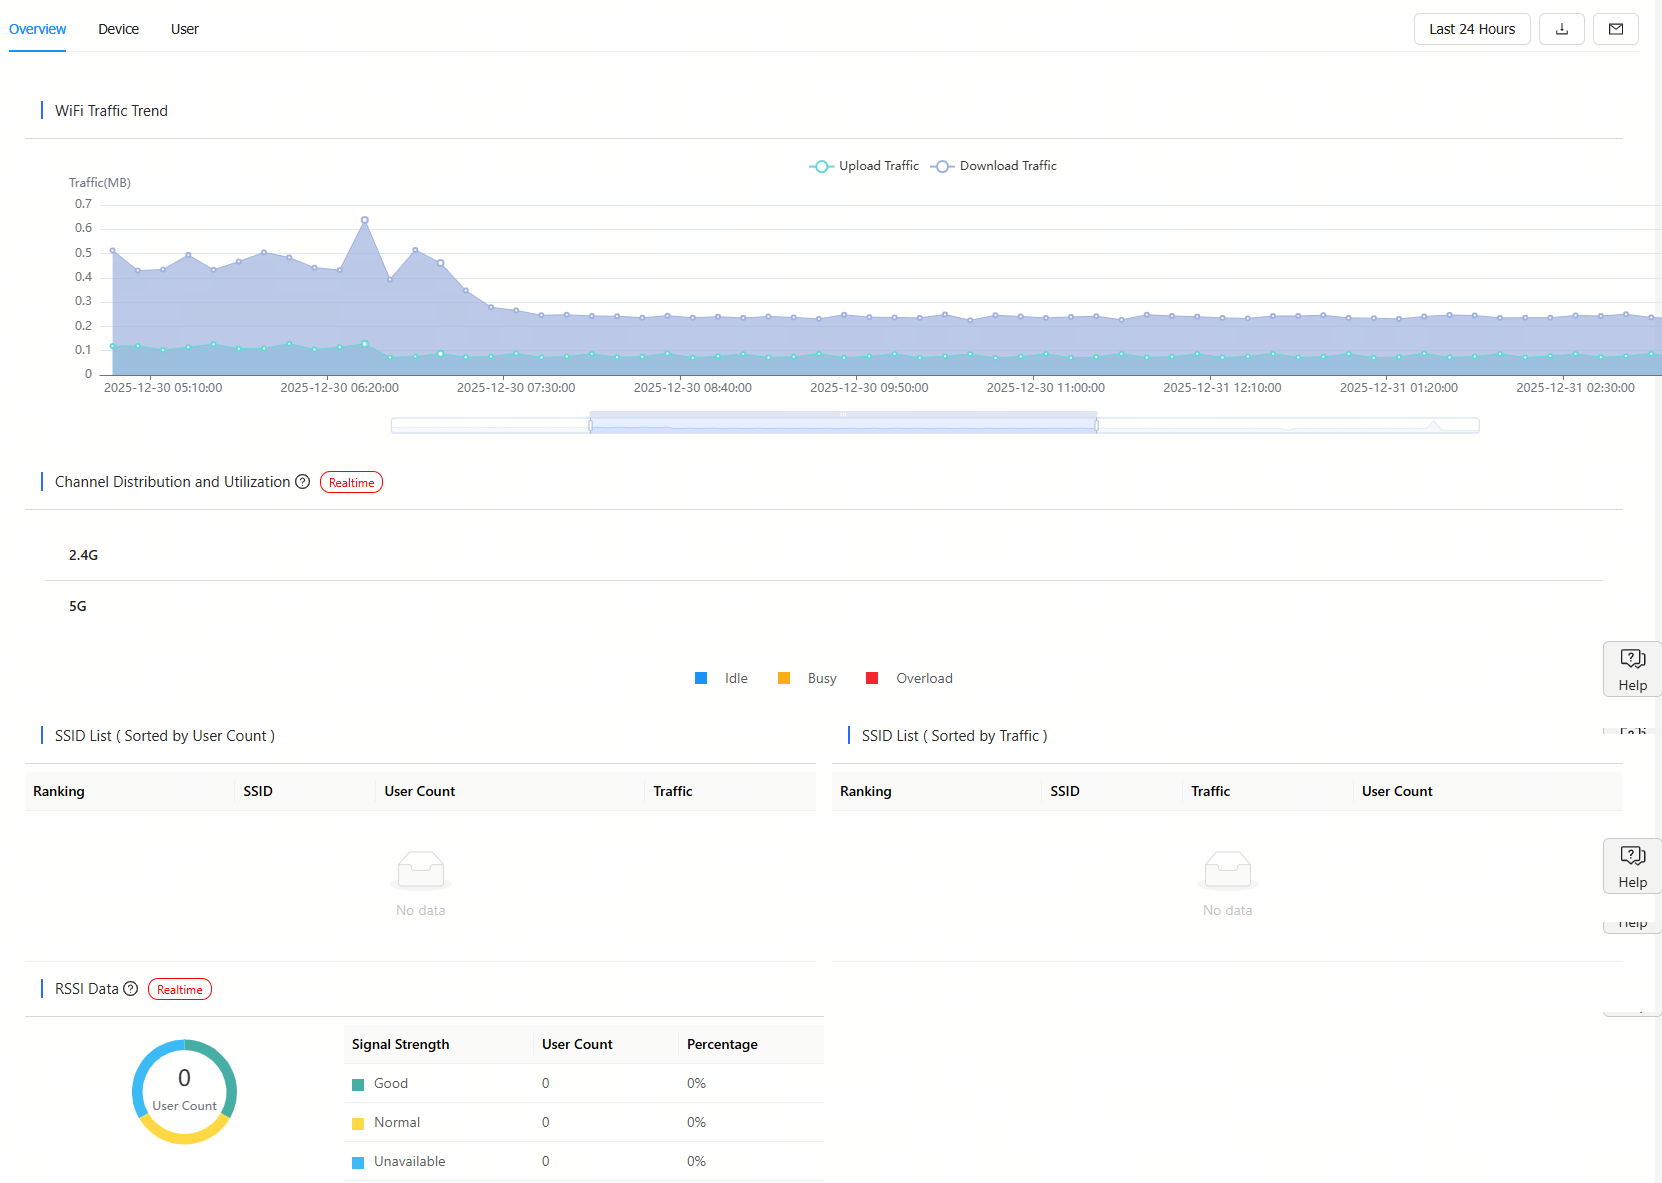
(1) WiFi Traffic Summary: Displays wireless traffic data for the last 24 hours/last 7 days/last 30 days/custom time period. Hover the cursor over a time to view the uplink and downlink rates at that time.
(2) Channel Distribution and Usage: Displays channel distribution and usage of the selected project. Click a channel to view its detailed information. The channel usage is graded as: Idle: 0% to 59%; Busy: 60% to 79%; Overloaded: 80% to 100%
(3) SSIDs by Client: Displays ranking information of the number of clients connected to the selected network by SSID in the last 24 hours/last7 days/last 30 days /custom time period
(4) SSIDs by Traffic: Displays the SSIDs ranked by client number of the selected project in the past 24 hours/last 7 days/last 30 days/custom time period.
(5) RSSI Statistics: Displays the real-time wireless signal strength of the selected project during the specific period. The signal intensity is defined as: Weak: RSSI ≤-80dB; Medium: -80dB < RSSI≤-70dB; Strong: RSSI > -70dB.
2. Device Tab
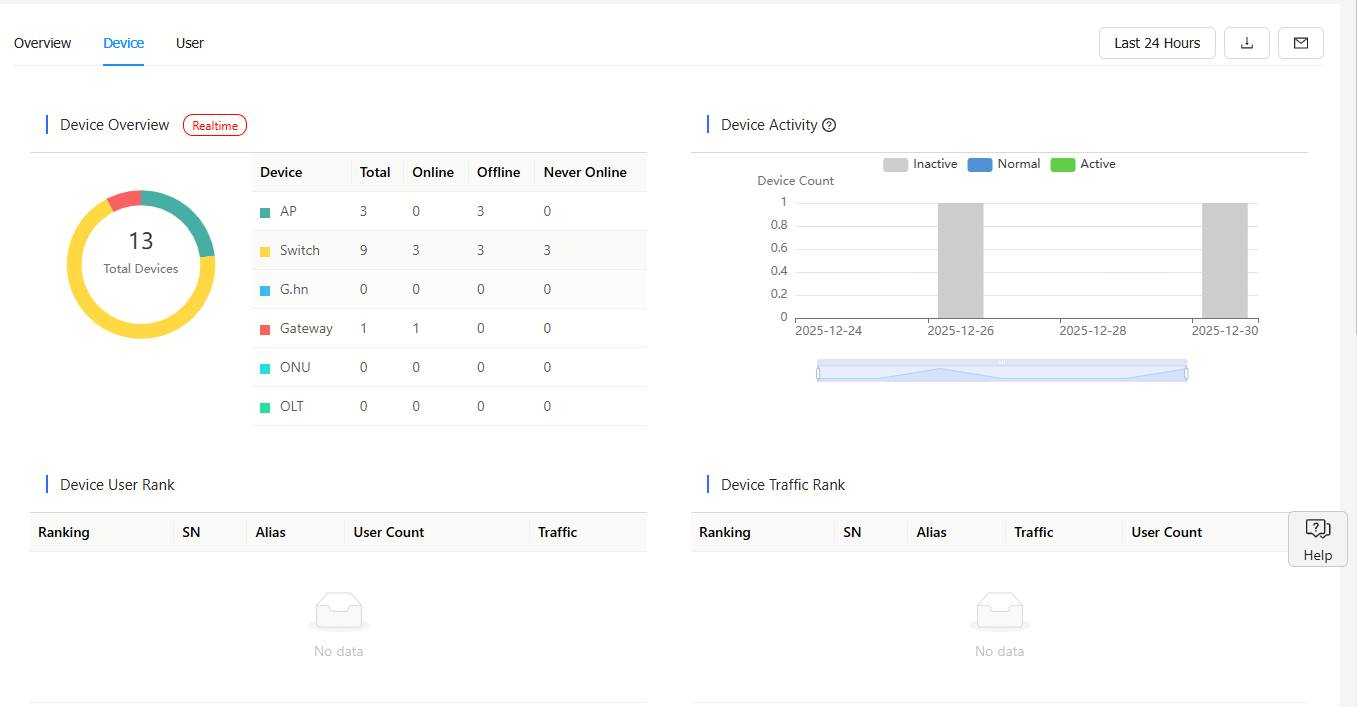
(1) Device Summary: Displays the online status of devices in the project during a specific period.
(2) AP Activity: Displays the AP activity of the selected project during the specific period. The chart does not support searching data in the last 24 hours. AP activity is evaluated based on the number of active clients accessing the AP in a day. APs not associated with any clients are not calculated.
(3) Top 10 APs by Client: Displays the top 10 APs ranked by client number of the selected project during the specific period.
(4) Top 10 APs by Traffic: Displays the top 10 APs ranked by traffic of the selected project during the specific period.
(5) Firmware Version: Displays the proportion of firmware versions of the selected project during the specific period.
(6) Hardware Version: Displays the proportion of hardware versions of the selected project during the specific period.
(7) PoE Utilization: Displays the numbers of PoE switches above and below the selected utilization percentage.
(8) PoE Power Summary: Displays the power summary of the entire PoE device, including the total power and used power.
3. Client Tab
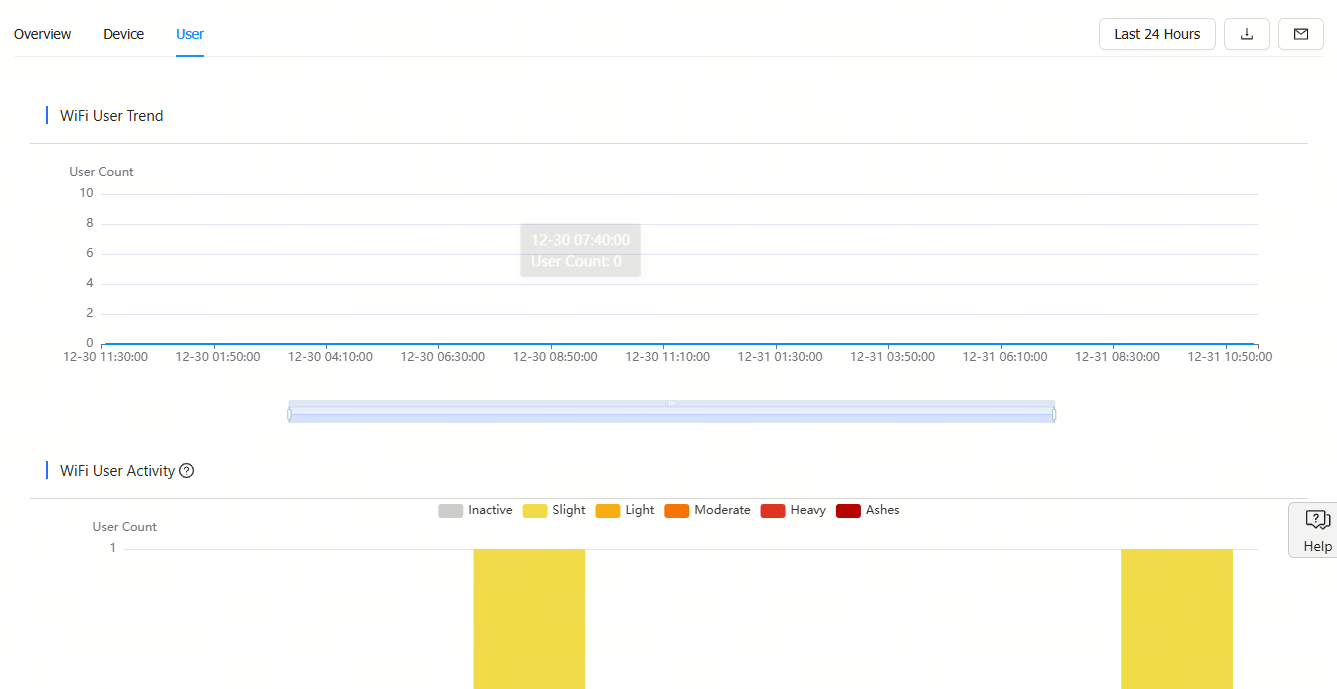
(1) WiFi Client Summary: This chart shows the client summary of the selected project during the specific period. Hover the cursor over a moment to view the number of clients at that moment.
(2) WiFi Client Activity: This chart shows the client activity of the selected project during the specific period. The chart does not support searching data in the last 24 hours.
(3) 2.4G/5G Clients: This chart shows the proportion of STAs using 2.4G/5G of the selected project during the specific period.
(4) Top 10 WiFi Clients by Traffic: Displays the top 10 clients ranked by traffic of the selected network during the specific period.
(5) Captive Portal: This chart shows the numbers and proportions of different portal authentication methods in the selected project. The statistics are refreshed every hour. Now 3 authentication methods (one-click, voucher and account) are supported.
(6) Experience: This chart shows the experience status during the specified time and collects data every 5 minutes. You can switch between 2.4GHz and 5 GHz. Hover your cursor over a specific time to view the experience status at that time.
Score: Take the parameters of client delay, client packet loss, signal strength and so on as the reference, and then use the SVM algorithm to get the score.
全部评论